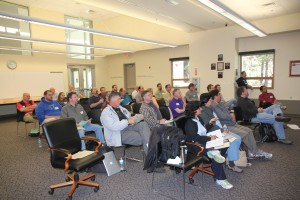
Month: April 2012

Mark Hurwitz, Fathom in the Physics Lab
Mark demonstrated how to use the Fathom program with Vernier probes to graph and analyze experimental data. The program allows students to quickly drag and drop meters, tables, graphs and more. Students can also manipulate graphs so that they can visually see the differences between their data analysis and what they expect to see. Mark’s students are able to use the program at home as well so that they can continue to analyze their information. Fathom only works with Vernier probes.
Election of officers:
David Marasco will continue as President, and will also absorb Program Chair
Dennis Buckley will continue as Treasurer and Membership Coordinator
Frank Cascarano will continue as VP Colleges/ Universities
Leanna Felardo will continue as VP of High Schools
Bree Barnett Dreyfuss will continue as Secretary
Lee Trampleasure will continue as Webmaster and will also be the Section Rep
Paul Robinson will continue as a Historian
Tom Woosnam will continue to provide insight as a Past President
David Bennum, Recruiting Physics Majors from Grades 2-8, University of Nevada, Reno There is little development of Physics curriculum in the lower grade levels and thus the population that could be interested in Physics is scared away. Dr. Bennum has created a “Physics on the Road” program that brings science into local schools to introduce young students to Physics. Dr. Bennum shared several pictures of his program over the years of students at assemblies and workshop with middle school and elementary school students. The program has reached up to 2,000 students in the K-8 programs each year. He continues to…
Lee Trampleasure, Carondelet High School – deriving the kinematics equation experimentally
Students use TI calculators to derive the kinematics equations. Students graph a linear position-time graph for different constant velocity cars. Student graph the data by hand and then uses linear regression to calculate the slope which will vary from student to student as their best fit lines differ. Students then plot a constant acceleration car and graph that data in their calculators. By taking various tangent lines students create a separate graph of the velocity-time for the car. Using the equation supplied by the calculator they begin to see the relationship between their y-intercept on the y=ax+b equation from the velocity-time graph matches the b in their equation for the position to time graph (x=at^2+bt+c).
David Talcott, Carlmont High School (c/o Bree) – Planck’s constant apparatus